EPOXI
Two intriguing investigations -- One flight-proven spacecraft
Gallery
Deep Impact Resolves Hartley's Jets in Action
Animation 1: HRI movie of jets. Left panel shows how the comet appeared. Right panel has had the average coma removed to better show the jets. Download
Video Credit: Don J. Lindler, Sigma Space Corporation and NASA/JPL-Caltech/UMD
Formats
Animation 2: MRI movie of jets. Left panel shows how the comet appeared. Right panel has had the average coma removed to better show the jets. Download
Video Credit: NASA/JPL-Caltech/UMD (Tony Farnham)
Formats
Caption: The High Resolution and Medium Resolution Imagers (HRI and MRI) have captured great views of multiple jets turning on and off while the spacecraft is 8 million km away from the comet. These movies, one from HRI and one from MRI, show the progression of two jets during a 16 hour time period. The Sun is located to the right. The left-hand panels of each movie are compilations of data (HRI data have been deconvolved). The average coma has been removed from the data to enhance the jet structure in the right-hand panels. At 15:20 UTC on October 26, 2010, a faint jet turns on and rotates into view in the HRI data. The faint jet is also detected in the MRI data. The jet rotates about 90 degrees in projection before turning off. The nucleus is rather quiescent at the end of the day. A much larger jet turns on at 1:00 UTC on October 27, 2010, and originates at nearly the same projection angle onto the sky. This suggests that both jets originate from similar latitudes. MRI pixels are five times larger than the HRI, so some details in the HRI movie may be delayed or not appear in the MRI, like the innermost structure of the jets, while the MRI has a larger field of view, allowing late stages of the jets to be viewed.
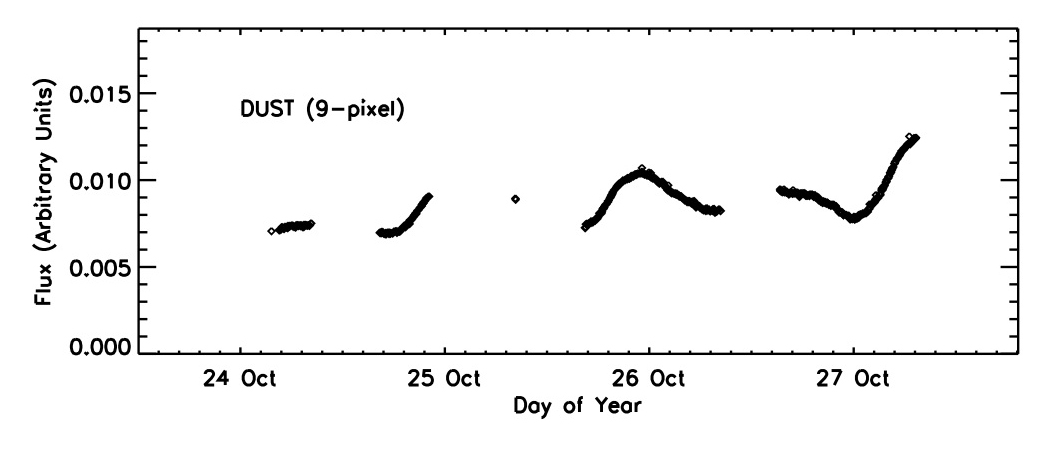
The structure in these images is complementary to the light curve (below) derived from the MRI clear filter photometry of the dust coma. The timing of the large jet corresponds to the large peak in the lightcurve. Together, the data tell us about the rotation of Hartley's nucleus.
 Click for larger image.
Fig 1: Lightcurve derived from MRI clear filter photometry of the dust coma.
Credit: NASA/JPL-Caltech/UMD
103P spectra, lightcurves...
- 2010-10-27 CN coma
- 2010-10-27 jets, lightcurve
- 2010-10-21 lightcurve
- 2010-10-16 spectrum
103P on...
- 2010-11-25 Image release #22
- 2010-11-21 Image release #21
- 2010-11-16 Image release #20
- 2010-11-11 Image release #19
- 2010-11-06 Image release #18
- 2010-11-04 Image release #17
- 2010-11-04 Image release #16
- 2010-11-04 Image release #15
- 2010-11-04 Image release #14
- 2010-11-04 Image release #13
- 2010-11-02 Image release #12
- 2010-11-01 Image release #11
- 2010-10-31 Image release #10
- 2010-10-30 Image release #9
- 2010-10-29 Image release #8
- 2010-10-23 Image release #7
- 2010-10-22 Image release #6
- 2010-10-01 Image release #5
- 2010-09-25 Image release #4
- 2010-09-20 Image release #3
- 2010-09-13 Image release #2
- 2010-09-05 Image release #1
- EPOXI EPO Lead: Dr. Lori Feaga
- Webmaster: Elizabeth Warner
- Last Updated: Fri 02/23/18
- Web Accessibility
- + Contact NASA